When you’re managing data in Salesforce, you’ve likely come across two powerful tools designed to help you track, analyze, and interact with records: list views and reports. But which one should you use? Recognizing the key distinctions between them can assist you. decide when each tool is best suited for your needs. Let’s break down how List Views and Reports compare and explore when to use each tool to maximize your efficiency in Salesforce.
1. What Are Salesforce List Views?
A List View in Salesforce is essentially a customizable table that displays a set of records based on your chosen criteria. It provides a straightforward way to filter and view specific sets of data, such as accounts, opportunities, or tasks. You can access List Views from the home screen of each Salesforce object.
Key Features of List Views:
- Quick Data Access: List Views provide instant access to relevant records by allowing you to filter data by any field, such as Opportunity Stage or Lead Status. Perfect for quickly finding what you need without digging through large datasets.

- Inline Editing: With List Views, you can update records directly from the table. This is particularly helpful when you need to quickly make changes without opening each individual record.

- Simple Filters: List Views allow you to filter data based on fields within a single object. For example, you can view all accounts with a specific industry or opportunities closing in the next 30 days.

- Visibility Options: List Views can be private (only visible to you), shared with certain groups, or public across your organization.

When Should You Use List Views?
- Quick Access to Specific Records: List Views are ideal for when you need a quick, focused snapshot of data. For example, you can create a ListView for all open opportunities that are in a certain stage.
- Task-Oriented Updates: If you need to make simple updates, such as changing the status of leads or marking tasks as completed, List Views allow you to do this directly from the table.
- Smaller Data Sets: List Views work best when you’re dealing with a limited set of records. They’re not intended for heavy data analysis or complex reporting.
2. What Are Salesforce Reports?
Reports in Salesforce are designed for more detailed data analysis and can pull information from multiple objects. Reports enable you to filter, group, and summarize data in various formats. Reports can include visual elements like charts and graphs, making it easier to analyze and present data. Whether you’re tracking sales performance, assessing customer behavior, or reviewing pipeline progress, reports equip you with the tools needed for actionable data insights.
Notable Characteristics of Reports:
- Advanced Data Analysis: Reports enable detailed filtering and cross-object data analysis, allowing you to gain deeper insights from multiple sources within Salesforce. For example, you can create a report to show opportunities with related account data or leads with their associated contacts.
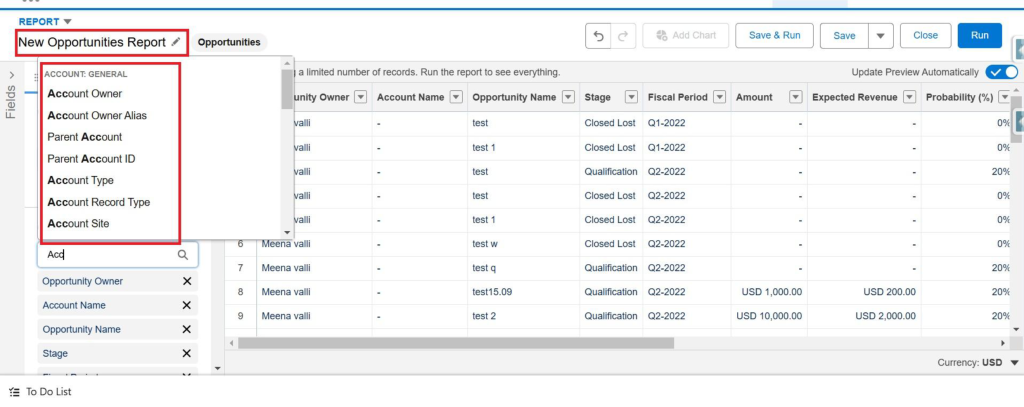
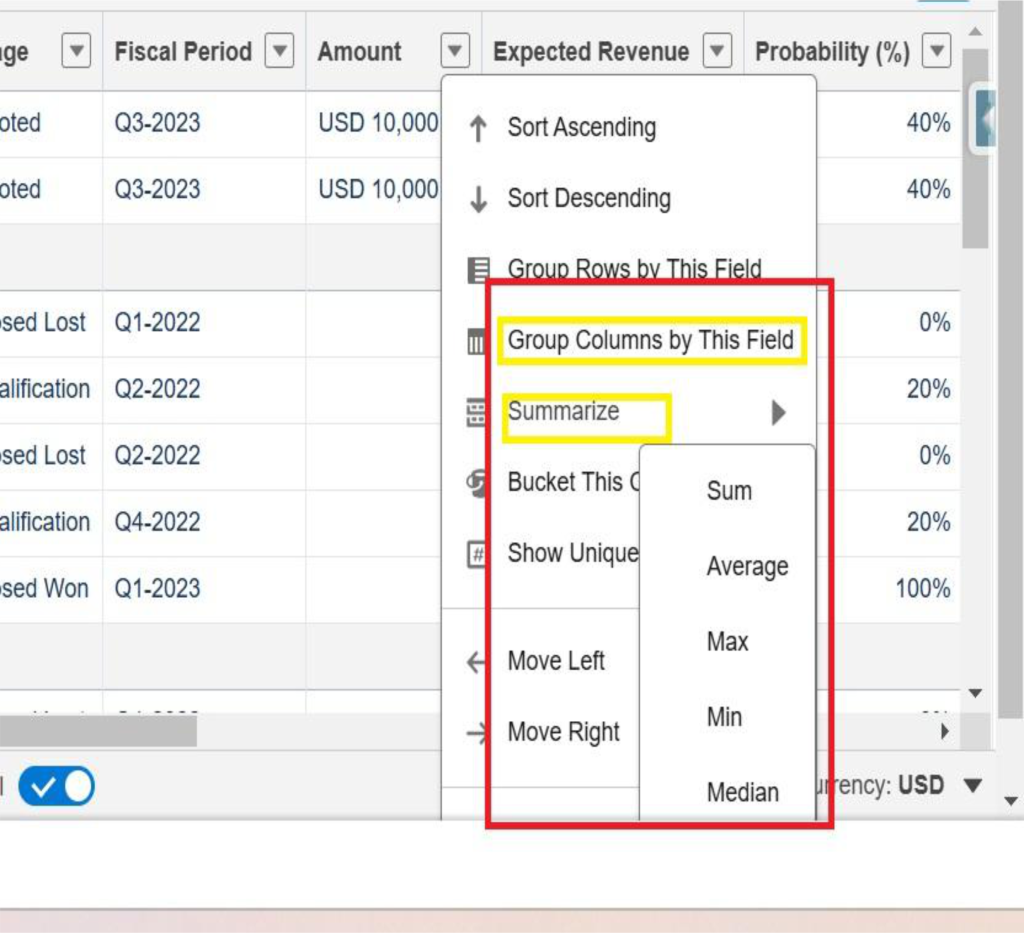
- Summarization and Grouping: With Reports, you can group data by different fields (e.g., opportunities by owner or leads by region) and calculate summaries like totals, averages, or percentages.
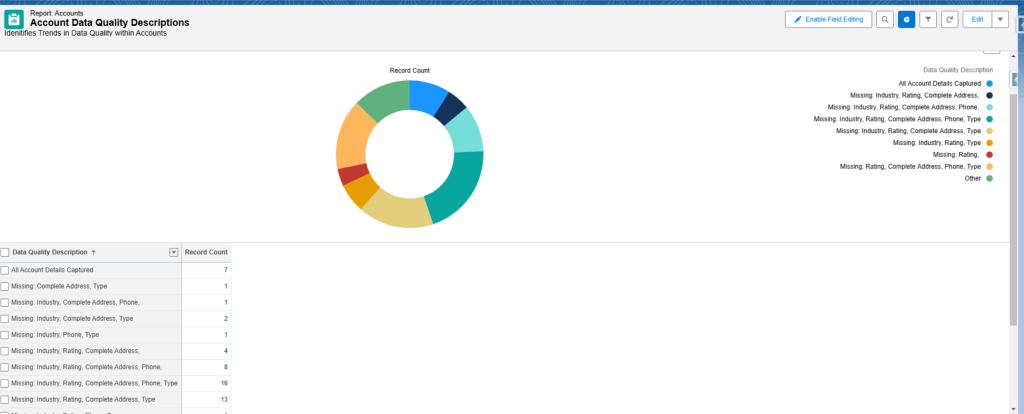
- Charts and Visualizations: Reports let you visualize your data with pie charts, bar graphs, and line charts, helping you to quickly spot trends and patterns.
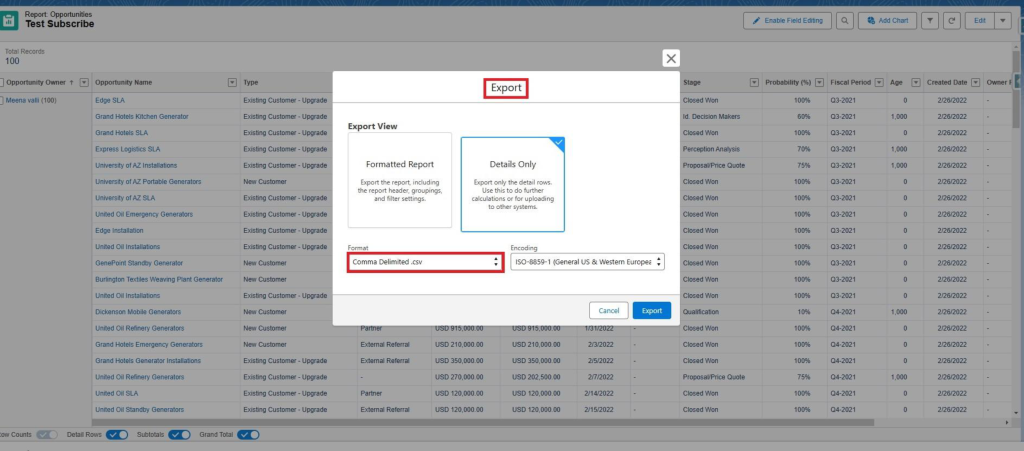
Scheduled and Exportable: Reports can be exported as Excel or CSV files, simplifying the process of sharing insights with stakeholders.
When Should You Use Reports?
- Data Analysis and Insights: Reports are ideal for when you need to dive deeper into your data. For example, if you need to track your sales performance across different teams or regions, a report with summaries and charts will give you a clearer view.
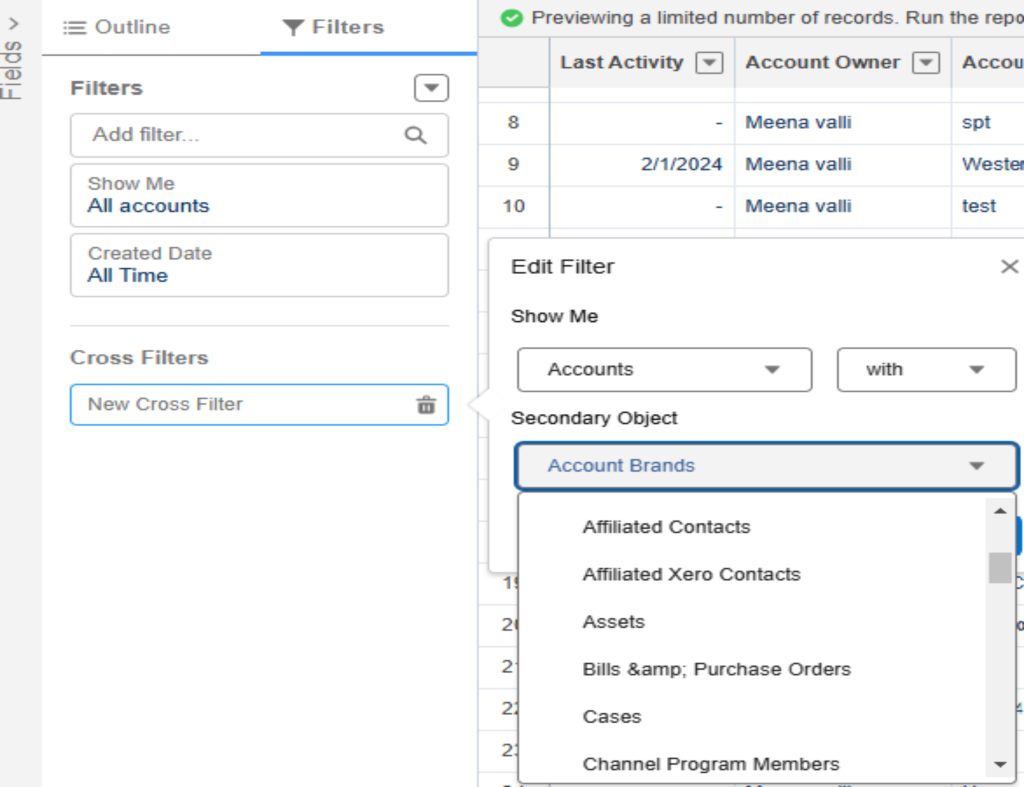
- Cross-Object Data: If you need to pull data from multiple related objects (like Opportunities, Accounts, and Contacts), Reports allow you to combine this information in one place.
- Presenting Data to Others: If you need to generate insights for stakeholders, reports allow you to create professional-looking summaries, which can be easily shared or added to dashboards.
3. List Views vs. Reports: A Side-by-Side Comparison
| Feature | List Views | Reports |
| Data Scope | Single Object | Single or Multiple Objects |
| Data Filters | Basic Filter | Advanced Filters with Logic |
| Inline Editing | Available | Available |
| Data Summaries | Limited | Grouping, Summaries, and Average |
| Charts & Visuals | Available | Multiple Chart Options |
| Scheduling & Export | Not Available | Scheduling, Export, and Sharing |
| Complex Data Needs | Limited | Suitable for Complex Analysis |
4. Which Should You Use for Your Needs?
The choice between List Views and Reports really depends on what you’re trying to accomplish. Here are some key questions to ask yourself when deciding which tool is best:
- Do I need to quickly access and interact with specific records? If yes, a List View is the way to go.
- Am I performing detailed data analysis, like tracking trends or comparing multiple objects? In this case, a Report would be better.
- Do I need to make quick updates to records? Use List Views to edit fields directly in the list without having to open each record.
- Is visualizing data important to my analysis or presentation? For charts and graphs, Reports are ideal.
5. How to Get the Best of Both Worlds
In many cases, you may want to use both List Views and Reports in tandem. For example:
- Start with a List View to quickly identify and filter records you want to work with.
- Transition to a Report when you need to analyze trends or visualize performance over time.
By combining these tools, you can streamline your day-to-day workflow while also gaining deeper insights into your data.
Conclusion
List Views and Reports are crucial tools in Salesforce, each serving a unique purpose. List Views provide quick access to specific records and enable real-time updates, making them ideal for immediate information needs. On the other hand, Reports offer advanced data analysis and visualizations, delivering deeper insights into your data. By recognizing the strengths of each tool and knowing when to use them, you can enhance your efficiency in Salesforce and make more informed, data-driven decisions
